There is no separate report page for dunning – you analyse it with the built-in tools of the dunning area. This article shows which questions they can answer, where the limits are, and which rhythm has proven itself. Where each element sits is described in Open receivables at a glance.
What the key figures tell you
The case volume (number of active dunning cases) is a trend figure: if it rises over weeks, the cause is rarely individual customers but your payment terms or customer mix.
The outstanding amounts per currency are the figure for your liquidity risk – not the case count. Ten small amounts are a different problem from one large customer.
The number of cases on hold should stay close to zero permanently. A dunning hold is a deferred decision, not a state.
By dunning level: how many cases are stuck at late levels? A cluster at the top end points to structural payment problems, not to isolated cases.
By customer: spot repeat offenders. For notorious late payers, shorter payment terms or advance payment are worthwhile.
By dunning type: this shows how much of your receivables stems from reversed payments rather than ordinary late payment. A high chargeback share is a payment-method problem, not a dunning problem.
The limit: everything looks forward
The period filter narrows down to cases whose next escalation falls within a coming window. Comparing past months is not provided for in the dunning area, and there is no historical chart. If you want to evidence trends, note the key figures yourself at a fixed interval – or analyse the invoice list from the CSV export (sidebar → "Exports").
The forecast: looking ahead
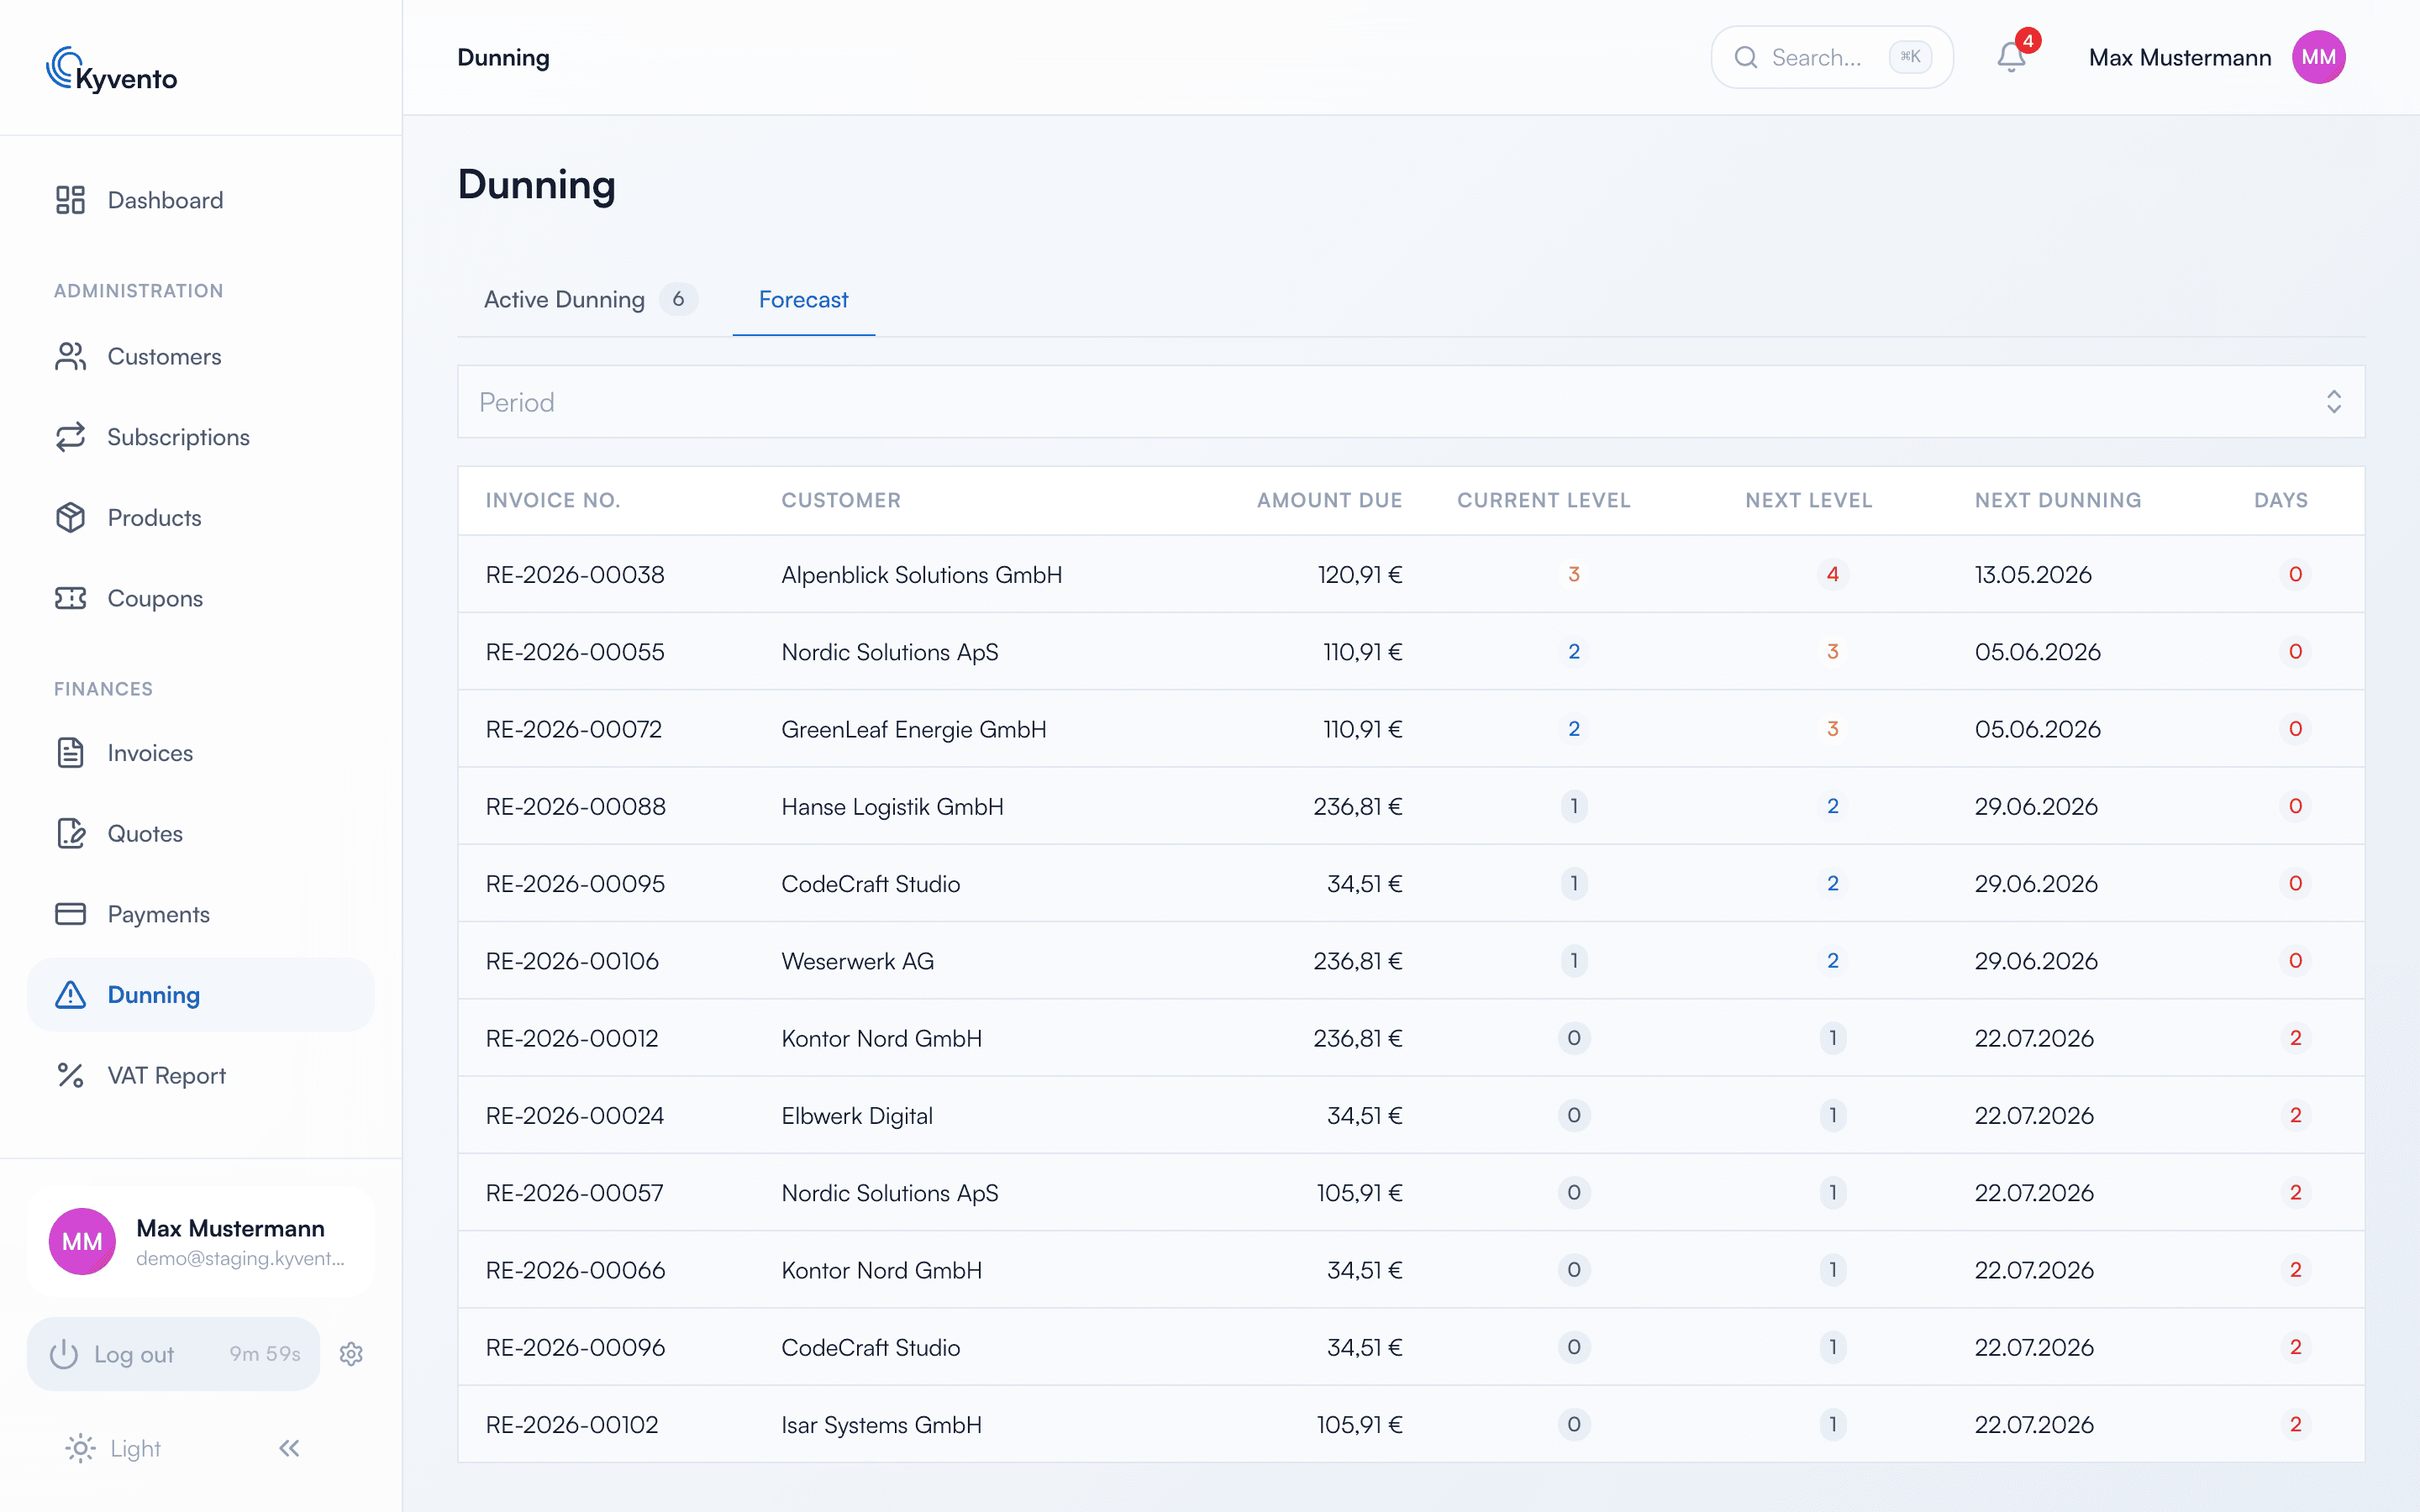
The forecast is the only tool that lets you intervene before an escalation. In practice you use it to:
contact customers with high amounts personally before the next level,
prepare the support team for upcoming waves of dunning,
spot cases where a dunning hold makes more sense than the next level.
The forecast: which dunning notice is due when – with a countdown per invoice
Recommended rhythm
Weekly: check the forecast, tackle large cases proactively.
Monthly: note the key figures and compare them with the previous month.
Quarterly: decide on uncollectibles, adjust conditions for repeat offenders.